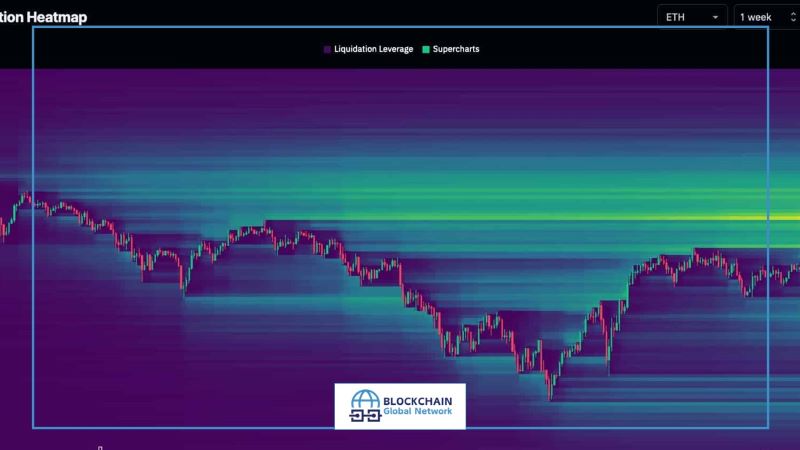
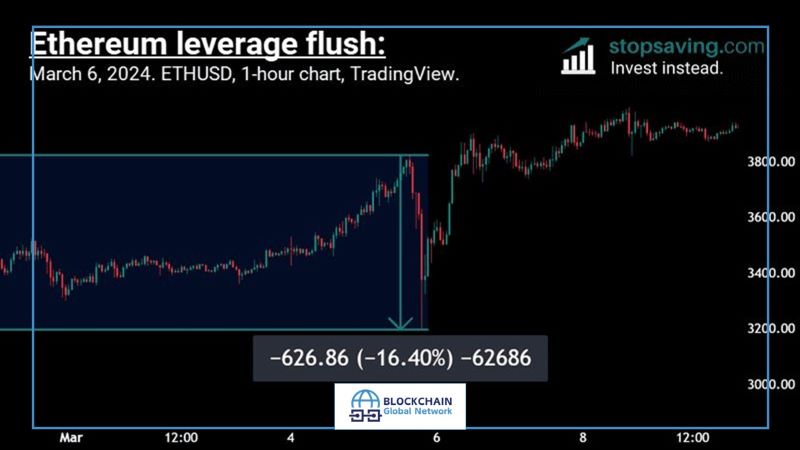
In the fast-paced trading world, understanding market trends is essential for success. Funding rate heatmap is powerful tools that provide insights into funding rates across various cryptocurrencies. By mapping these rates, traders can identify potential opportunities and market sentiments, enabling them to make informed decisions. This article explores how to effectively utilize funding rate heatmaps to enhance your trading strategies.
What’s Funding Rate Heatmap?
A funding rate heatmap is an essential analytical tool used in cryptocurrency trading that provides traders with a visual representation of funding rates across various trading pairs. Funding rates are crucial in the perpetual futures market, as they determine the periodic payments made between long and short positions. Understanding how these rates fluctuate can significantly influence a trader’s strategy and overall profitability.
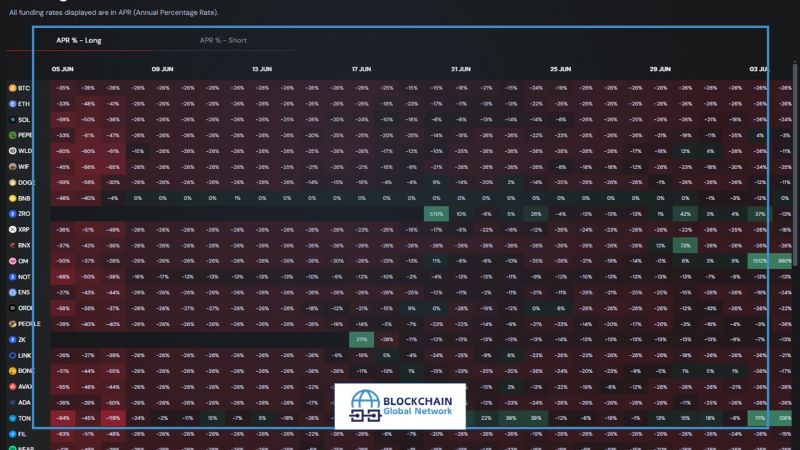
The funding rate heatmap displays funding rates using a color-coded system, often featuring gradients to indicate the intensity of the rates. For instance, a bright green color may indicate a high funding rate for long positions, suggesting that traders holding long positions are paying a premium to those with short positions. Conversely, a bright red may indicate a higher funding rate for short positions, signaling that short traders are paying long holders. This immediate visual cue allows traders to quickly gauge the prevailing market sentiment.

By analyzing the funding rate heatmap, traders can identify trends in market sentiment. For example, if the heatmap shows consistently high funding rates for long positions, it may indicate a bullish sentiment, prompting traders to consider entering long positions. On the other hand, if short positions dominate the heatmap with elevated funding rates, this may signal a bearish market trend, influencing traders to adjust their strategies accordingly.
Moreover, the funding rate heatmap can help traders anticipate potential price movements. High funding rates can often lead to increased volatility as traders adjust their positions to avoid significant losses. Understanding these dynamics enables traders to time their entries and exits more effectively, maximizing their potential returns.
The funding rate heatmap is a powerful tool that offers deep insights into market conditions, helping traders make informed decisions based on current funding rates. By effectively utilizing this tool, traders can navigate the complexities of the cryptocurrency market, positioning themselves to capitalize on trends and optimize their trading strategies. Whether you are a seasoned trader or just starting, incorporating the funding rate heatmap into your analysis can significantly enhance your trading effectiveness.
How the Funding Rate Heatmap Works?

The funding rate heatmap operates as a dynamic tool that visualizes the cost of holding long and short positions in the perpetual futures market, enabling traders to assess market sentiment and make informed trading decisions.
- Understanding Funding Rates: The funding rate is a periodic payment exchanged between long and short traders based on their respective positions. It is calculated to ensure that the price of perpetual futures stays close to the underlying asset’s price. If the price of the perpetual contract is higher than the spot price, long positions pay a funding fee to short positions and vice versa.
- Data Collection: The funding rate heatmap aggregates real-time funding rate data from multiple exchanges and trading pairs. It collects this data at regular intervals, such as every 8 hours, reflecting the current market conditions and sentiment. This information is sourced from platforms that offer perpetual futures contracts, which is crucial for accurately displaying funding rates.
- Visual Representation: The collected funding rate data is then translated into a visual format, usually employing a color gradient scale. Different colors represent varying levels of funding rates:
- High Funding Rates: Bright or dark colors may signify elevated funding rates, indicating that long or short positions are costly to maintain. For example, a bright green might represent a high cost for long traders, suggesting strong bullish sentiment.
- Low Funding Rates: Cooler colors, like blue or light shades, may indicate low funding rates, suggesting less pressure on traders and potentially a neutral market sentiment.
- Analyzing Market Sentiment: Traders utilize the funding rate heatmap to gauge overall market sentiment. For instance, if long positions are associated with consistently high funding rates across various pairs, it signals a bullish market where demand for long positions outweighs that for shorts. Conversely, high rates for shorts could indicate bearish sentiment and increased selling pressure.
- Strategic Insights: By analyzing the heatmap, traders can identify trends and adjust their strategies accordingly. For instance:
- If the heatmap shows a sudden spike in funding rates for long positions, it may prompt traders to reconsider holding long positions due to the potential for price corrections.
- Conversely, a decrease in funding rates for short positions might encourage traders to enter short positions as the market appears to stabilize.
- Timing and Position Management: The funding rate heatmap allows traders to time their entries and exits effectively. If a trader notices a shift in funding rates indicating a potential reversal or trend change, they can adjust their strategies to minimize risk and maximize potential returns.
Benefits of Using Funding Rate Heatmap

Utilizing a funding rate heatmap offers several significant benefits for traders in the cryptocurrency and derivatives markets.
- Enhanced Decision-Making: The funding rate heatmap provides traders with a quick visual representation of the current market dynamics. By easily identifying funding rates across various trading pairs, traders can make faster and more informed decisions about entering or exiting positions. This real-time analysis can be critical in fast-moving markets.
- Risk Management: By observing the funding rates, traders can gauge the potential risks associated with their positions. A consistently high funding rate for long positions may signal excessive bullish sentiment, which can precede a price correction. Traders can use this insight to manage their risk effectively, adjusting their position sizes or implementing stop-loss orders accordingly.
- Identifying Market Trends: The funding rate heatmap can help traders identify emerging market trends. For example, a sudden increase in funding rates across multiple assets could indicate a shift in sentiment, allowing traders to capitalize on potential price movements. Recognizing these trends early enables traders to position themselves advantageously.
- Strategic Positioning: Traders can utilize the heatmap to align their strategies with prevailing market conditions. For instance, if the heatmap indicates low funding rates, it may suggest that the market is stabilizing or moving sideways. Traders can adopt a range-bound strategy or look for breakout opportunities based on this analysis.
- Improved Understanding of Market Sentiment: The heatmap serves as a barometer for overall market sentiment, enabling traders to understand the broader context of price movements. By interpreting the funding rates in conjunction with other market indicators, traders can develop a more comprehensive view of market psychology, helping them anticipate potential reversals or continuations.
- Opportunity for Arbitrage: The funding rate heatmap can reveal discrepancies in funding rates between different exchanges. Traders can take advantage of these differences through arbitrage strategies, simultaneously holding positions on different platforms to profit from varying funding rates. This can enhance their overall returns while mitigating risks.
- Long-Term Planning: Beyond immediate trading strategies, the funding rate heatmap can assist in long-term investment planning. By analyzing historical funding rate trends, investors can assess the potential sustainability of certain positions or the health of specific assets, making it easier to align their investment strategies with market cycles.
- Community Insight: As traders share their analyses and strategies based on the funding rate heatmap, it fosters a sense of community and collaboration. Engaging with other traders and learning from their insights can further enhance one’s understanding of market dynamics, ultimately leading to more successful trading outcomes.
Funding rate heatmap are vital tools for cryptocurrency traders, providing insights that enhance decision-making and risk management. By leveraging these heatmaps, traders can identify opportunities and improve their strategies for profitable outcomes, as highlighted by Blockchain Global Network.

RELATED POSTS
Staying Ahead: Essential Crypto Market News Updates
Sự biến động không ngừng...
Comedian Airdrop – Token BAN Leads the Memecoin Trend
In the world of memecoins,...
Blockchain Crypto Technology – Transforming Traditional Finance with Decentralization
Curious about how Blockchain Crypto...
What is KYC in Crypto? The Key to safer and transparent trading
What is KYC in Crypto...
How to Participate in the Avail Airdrop and Earn $AVAIL Tokens Breakthrough
Avail Airdrop offers a simple...
Zircuit Airdrop – Breakthrough Potential for Early Investors!
Zircuit Airdrop is not just...
Economic Bubble in Crypto – 3 Experiences to deal with it
In the volatile cryptocurrency landscape,...
What is the Cryptocurrency Market? How Transactions Work on the Blockchain
Curious about what is the...
BulbaSwap Airdrop: A unique investment opportunity in DeFi
BulbaSwap, a decentralized exchange (DEX)...
Crypto news predictions – Key Trends in the future
Crypto news predictions are essential...
What is Bitcoin Lightning Network? Revolutionizing Crypto Transactions
What is Bitcoin Lightning Network?...
What is Karak? Guide to joining Restaking
In the dynamic cryptocurrency market...
BoxBet Airdrop – Your Ultimate Guide to Earning BXBT Tokens
The BoxBet Airdrop is making...
Crypto Crashing and 3 important investment implications
Crypto Crashing has shaken the...
Unraveling the Mystery: Cryptocurrency vs. Blockchain Demystified
Understanding the Difference: Cryptocurrency vs....
Messari Crypto: A powerful tool for investors
In the world of cryptocurrency,...