Navigating the ebb and flow of digital currency markets demands more than just intuition; it calls for a solid cryptocurrency analysis method. My toolkit, tried and tested over countless trades, peels back the layers to expose the market’s heartbeat. You will learn how to spot the subtle signs that signal big moves. I’ll guide you through the basics and into the depths of technical and fundamental analysis. We’ll look at prices, charts, and news with a keen eye, shaping strategies that sidestep risks while harnessing the power of market mood. Together, we’ll dive into on-chain data, getting ahead of the trends that puzzle so many. Ready to trade with precision? Let’s chart the course.
Understanding the Basics of Cryptocurrency Technical Analysis
Interpreting Price Action Patterns for Market Prediction
Look at charts and see shapes? That’s reading price action. It tells us what traders think. Imagine if you could spot a pattern like the “head and shoulders” on a Bitcoin chart. Say it with me: “Head and shoulders.” Now, isn’t it neat how this simple pattern hints a price drop might come? Let’s break it down. First, the price climbs to a peak, then drops. Then, it climbs higher, making the “head,” and drops again. Lastly, it rises up but not as high, forming the second “shoulder.” When the price then falls below the shoulders, traders yell “Sell!”
Looking at price movements, we aim for more wins than losses. No tool predicts 100% right. But, price shapes boost our chances at smart trades. How? By watching, you’re learning from the past. Price action patterns are like clues. They don’t shout, “Buy this now!” Instead, they whisper, “Hey, look here, something might happen.” It’s like a weather forecast for money.
Charting Crypto with Technical Tools
Next step: tools for charting crypto. “RSI,” – or Relative Strength Index, is a must-know. Think of it like a gas gauge. It measures if a coin’s trade is on “full” (overbought) or “empty” (oversold). RSI runs from 0 to 100. Above 70? Watch out, it could fall. Below 30? Might be time to buy.
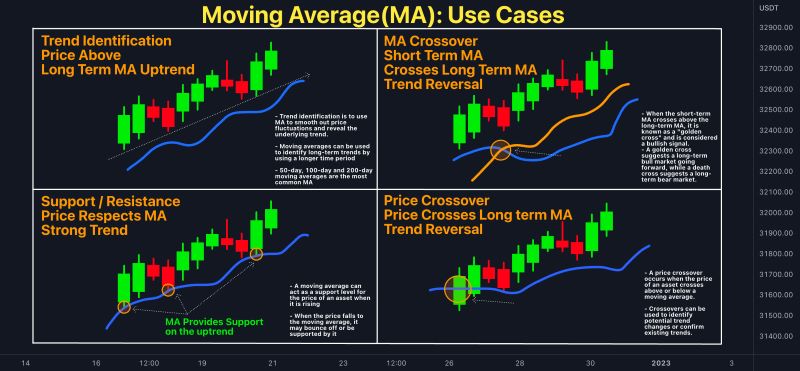
Moving averages (MA) are also key. These smooth out price swings to show a trend. Use them to see where the price may go. Look for crossovers, where one MA line crosses another. Fast over slow line? This could mean prices are on the up.
And don’t forget volume. Volume shows how much crypto is trading. High volume can back up a price move, making it stronger. Seeing a price rise with Big volume? The price might keep going up. But if volume is weak, take care, that move might not last.
Candlesticks talk about short-term price trends. Each “candle” has a body showing opening and closing prices. Little upper and lower lines, “wicks,” display highs and lows. “Green candles” mean prices went up. “Red candles” say they fell. This info helps us catch quick trends.
By combining these tools, we get a clearer picture. It’s like making a map of the market. With it, we’re set to spot golden opportunities, or steer clear of trouble. Remember, no one can see the future. But with a bit of practice and tech, we can make smarter bets in this wild crypto world.
Fundamental Analysis and Market Sentiment in Cryptocurrency
Assessing Economic Factors and News Impact
In crypto, we can’t ignore the daily news. World events, big deals, or law changes can make coin prices leap or dive. Keeping track of these is part of what we call fundamental analysis in crypto. This digs into coin health, using facts that touch money. These may be reports, market goals, or even who’s leading a coin’s team.
First, look at the project’s white paper. It tells us what the coin plans to do and how. A strong, clear white paper can mean a thriving future. But if it’s hard to read or feels off, watch out. Good or bad, this paper sways how folks see the coin.
Then, we check on the demand for this coin. Are folks using it? Is it growing in shops or online? More use can mean a rising price. But if no one wants it, the price might fall.
We can’t forget to peek at crypto mining and price relation too. The cost to make a coin, like Bitcoin’s setup, can push its lowest price. If mining costs are up, so might be the coin’s price.
News can rush in like a tide, changing prices fast. A tweet from a big shot, like a famous CEO, can send a coin up or down. So, stay sharp and watch for news that might swing the market.
Sentiment Analysis: Gauging the Mood of the Market
The mood of the market, or sentiment analysis for digital currencies, means getting the vibe from traders. Is the buzz good or bad? We look at forums, news, and even tweets to tell. This is a quick way to sense where prices might go.
Imagine seeing lots of chats about folks buying a new coin. This buzz could mean a demand jump is on the way. So, you might think the coin’s price is set to lift off. But if fear is in the air, with talks of selling or risks, the coin might face a rough ride.
Tools online can help track this mood. They scan loads of data and give us scores. High scores point to a good vibe; low scores mean maybe it’s time to hold tight. These tools are our eyes on the huge online world, catching moods we might miss.
But watch out! Moods swing and can trick us. That’s why we mix this with looking at charts and facts. We get a full picture by using crypto candlestick interpretation, moving averages crypto, and volume analysis in cryptocurrency. These bits let us see if the mood fits the real deals happening.
By mixing news, market moods, and hard facts, we give our best guess. This way, we stay smart and can dodge sharp falls and ride rising tides. We can’t say what will happen for sure, but we give our trades the best shot!
Advancing Crypto Trading Strategies and Risk Management
Crafting Strategies for Bitcoin and Altcoin Trading
As a crypto expert, I know that a good trading plan is key. It means knowing the market well. Just like a captain knows the sea, I study crypto charts and price patterns every day. This is what I call cryptocurrency technical analysis. It helps to predict price moves before they happen.
When I look at Bitcoin or any altcoin, I see stories in their price action patterns. These patterns show where the price might go next. I also use tools like moving averages and the RSI. Moving averages help smooth out price data over time. This makes trends easier to spot. The RSI, or Relative Strength Index, shows if a crypto is over or under bought.
Using these tools, I craft Bitcoin trading strategies. For altcoins, I do something similar. Each altcoin has its own pattern and market mood. Ethereum, for instance, isn’t just another Bitcoin. Its investment analysis needs a different touch.
Implementing Robust Risk Management Tactics
Now, let’s talk about staying safe while trading. Risk management in crypto trading is like wearing a seat belt. It’s all about making sure we don’t get hurt badly if something unexpected happens. Two big things I look at are liquidity and volatility.
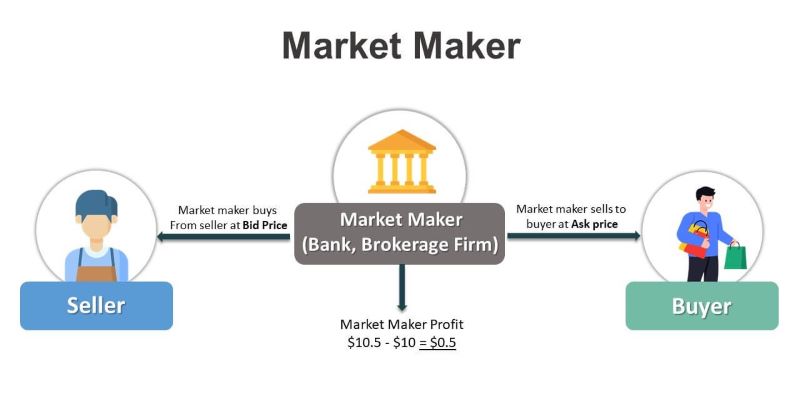
Liquidity means how easy it is to buy or sell crypto without affecting the price too much. Volatility is how wild price swings can be. A high volatility can mean big gains, but also big losses. So, I measure them both.
To manage risks, I don’t put all my eggs in one basket. This means I use cryptocurrency portfolio diversification. I don’t just trade Bitcoin. I also look at altcoins, DeFi projects, and sometimes NFT markets. By spreading out, I protect my trades from a single market’s ups and downs.
I also pay attention to crypto trading signals. But, I don’t just follow them blindly. I look at past price data and check the signals against the current market scene. Only when everything lines up, I make my move.
Lastly, I keep an eye on news and social media. They can greatly impact cryptocurrency value. A single tweet can send prices soaring or tumbling. So, being fast to catch these changes is part of the game.
By combining these trading strategies and risk management tactics, I navigate the crypto sea with a steady hand. It takes practice, but that’s how you turn crypto trading from a gamble into a skill.
On-Chain Data and Market Trend Analysis
Deciphering Blockchain Token Metrics
Let’s dive into blockchain tokens! Tokens store lots of info. Their metrics include transaction volumes, active addresses, and sometimes the total stash of some big players—crypto whales. Smart folks use this data to guess where the market’s heading.
Why do these numbers matter? They tell us if a token is getting more popular or not. More activity often means more folks buying and selling. This can push prices up or down. If you catch this early, you can make better trades.
We also look at sentiment analysis for digital currencies. What do people feel about a token? Are they excited or scared? By scanning social media, news, and forums, we get clues about the next big move. Always keep an eye out for these vibes.
Anticipating Shifts with Cryptocurrency Market Cycles
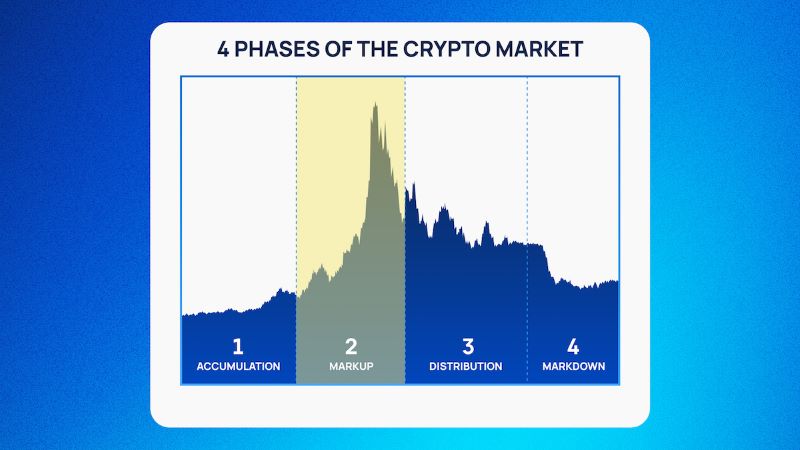
Now, get ready for the roller coaster—crypto market cycles. Understanding cycles helps us predict changes before they happen. A cycle has four parts: increase, peak, decrease, and bottom. It’s like seasons—one leads to the next.
In crypto, these cycles can be fast! When you see a sudden peak or drop, it’s time to act. Use crypto charting techniques and trading indicators for cryptocurrency to spot these patterns. Moving averages—just average prices over time—help see trends. The RSI, or Relative Strength Index, shows if something is over or underbought.
Remember, price isn’t everything. With volume analysis in cryptocurrency, you check if the number of trades supports the price change. If a price jumps but there’s not much trade volume, it might just be a fluke, not a trend
Keep track of news, too. Big announcements or shocks can set off new cycles. A game-changing update or a scary hack can swing prices a lot.
These are only pieces of the puzzle. Each token has its own rhythm. Compare them. How does a token behave against Bitcoin or Ethereum? These patterns can be golden for your cryptocurrency portfolio diversification.
Combine cryptocurrency technical analysis, fundamental analysis in crypto, and sentiment analysis for digital currencies. You’ll get a broad picture of what’s cooking in the market. Use historical price data crypto to see past trends. They often come back around.
Don’t forget, markets are sneaky. Always prep for surprises. That’s risk management in crypto trading—one of the smartest moves.
By checking blockchain token metrics and keeping an eye on cycles, you start seeing rhythms in the chaos. This makes sense of wild price swings and can guide your trades with more care. It’s not magic—just good, solid sleuthing on data and patterns. When you piece it all together, you can brave the crypto storm with confidence and a better chance at making smart moves.
In this post, we dove into cryptocurrency analysis. We learned how to read price action and use charts to guess where the market will go. We saw how news and the market’s mood can affect prices. We talked about how to make smart trading plans and manage risks. We also looked at blockchain data to spot market trends.
I think learning these skills is a must for anyone serious about crypto trading. It’s not just about the thrill of making a quick buck; it’s about smart investing. You now have tools to understand the market better, make smarter choices, and protect your money. With practice, you can get better at trading and maybe even stay ahead of the game. Remember, there’s always risk, but knowledge is your best bet for success. Keep learning and trading smart!
Q&A :
What Are the Common Methods for Analyzing Cryptocurrencies?
Cryptocurrency analysis is crucial for investors and traders to make informed decisions. Common methods include fundamental analysis, which looks into the underlying factors and value proposition of a cryptocurrency, and technical analysis, focusing on statistical trends gathered from trading activity. Other methods include sentiment analysis, which gauges the market mood, and on-chain analysis, which involves examining blockchain data for insights on network activity and health.
How Can Investors Conduct Technical Analysis for Cryptocurrencies?
Technical analysis in the realm of cryptocurrencies involves the meticulous study of price charts and trading volumes over different time frames. Investors use a variety of tools such as moving averages, support and resistance levels, and various indicators like the Relative Strength Index (RSI) or Moving Average Convergence Divergence (MACD). Patterns within the historical price data can help predict the short-term movement of cryptocurrency prices.
What Is Fundamental Analysis in Cryptocurrency Investing?
Fundamental analysis for cryptocurrency involves assessing a coin’s intrinsic value by examining various qualitative and quantitative factors. These factors include the project’s team experience, technology and use case, market demand, growth potential, tokenomics, and the broader economic environment. By analyzing these elements, investors can determine whether a cryptocurrency is under or overvalued.
Can Sentiment Analysis Be Used for Cryptocurrency Trading?
Yes, sentiment analysis can be a powerful tool for cryptocurrency trading. It involves analyzing the overall sentiment of the market from various sources like social media, news articles, forums, and blogs. Positive or negative trends in sentiment can indicate potential price movements since cryptocurrencies can be highly influenced by investor and public sentiment.
What Is On-chain Analysis in the Context of Cryptocurrencies?
On-chain analysis refers to the examination of all transactions recorded on a cryptocurrency’s blockchain. This method gives insights into factors such as network usage, transaction value, and wallet addresses. By studying these, analysts can get a sense of the cryptocurrency’s acceptance, the behavior of holders (e.g., HODLing vs. selling), and potential price movements. This type of analysis is unique to cryptocurrencies and is made possible due to the transparent nature of blockchain technology.


